On October 23, I gave a demonstration at the CSU AI and Business Community of Practice, facilitated by Zach Justus. I wanted to show how business professionals can take a vision for a website, dashboard, or presentation and work with agentic AI to build it.
The idea I started with was pretty simple. As business professionals, we often have a strong vision for something we need: a dashboard, an app, a website, or even a different way to give a presentation. With agentic AI, we can now take that vision and actually build it ourselves.
I started by showing the Wolff Technologies website, one of my first projects. The layout, navigation, and copy were all things I collaborated with Codex on. There was quite a bit of going back and forth, tweaking, and giving direction until it looked and sounded the way I wanted.
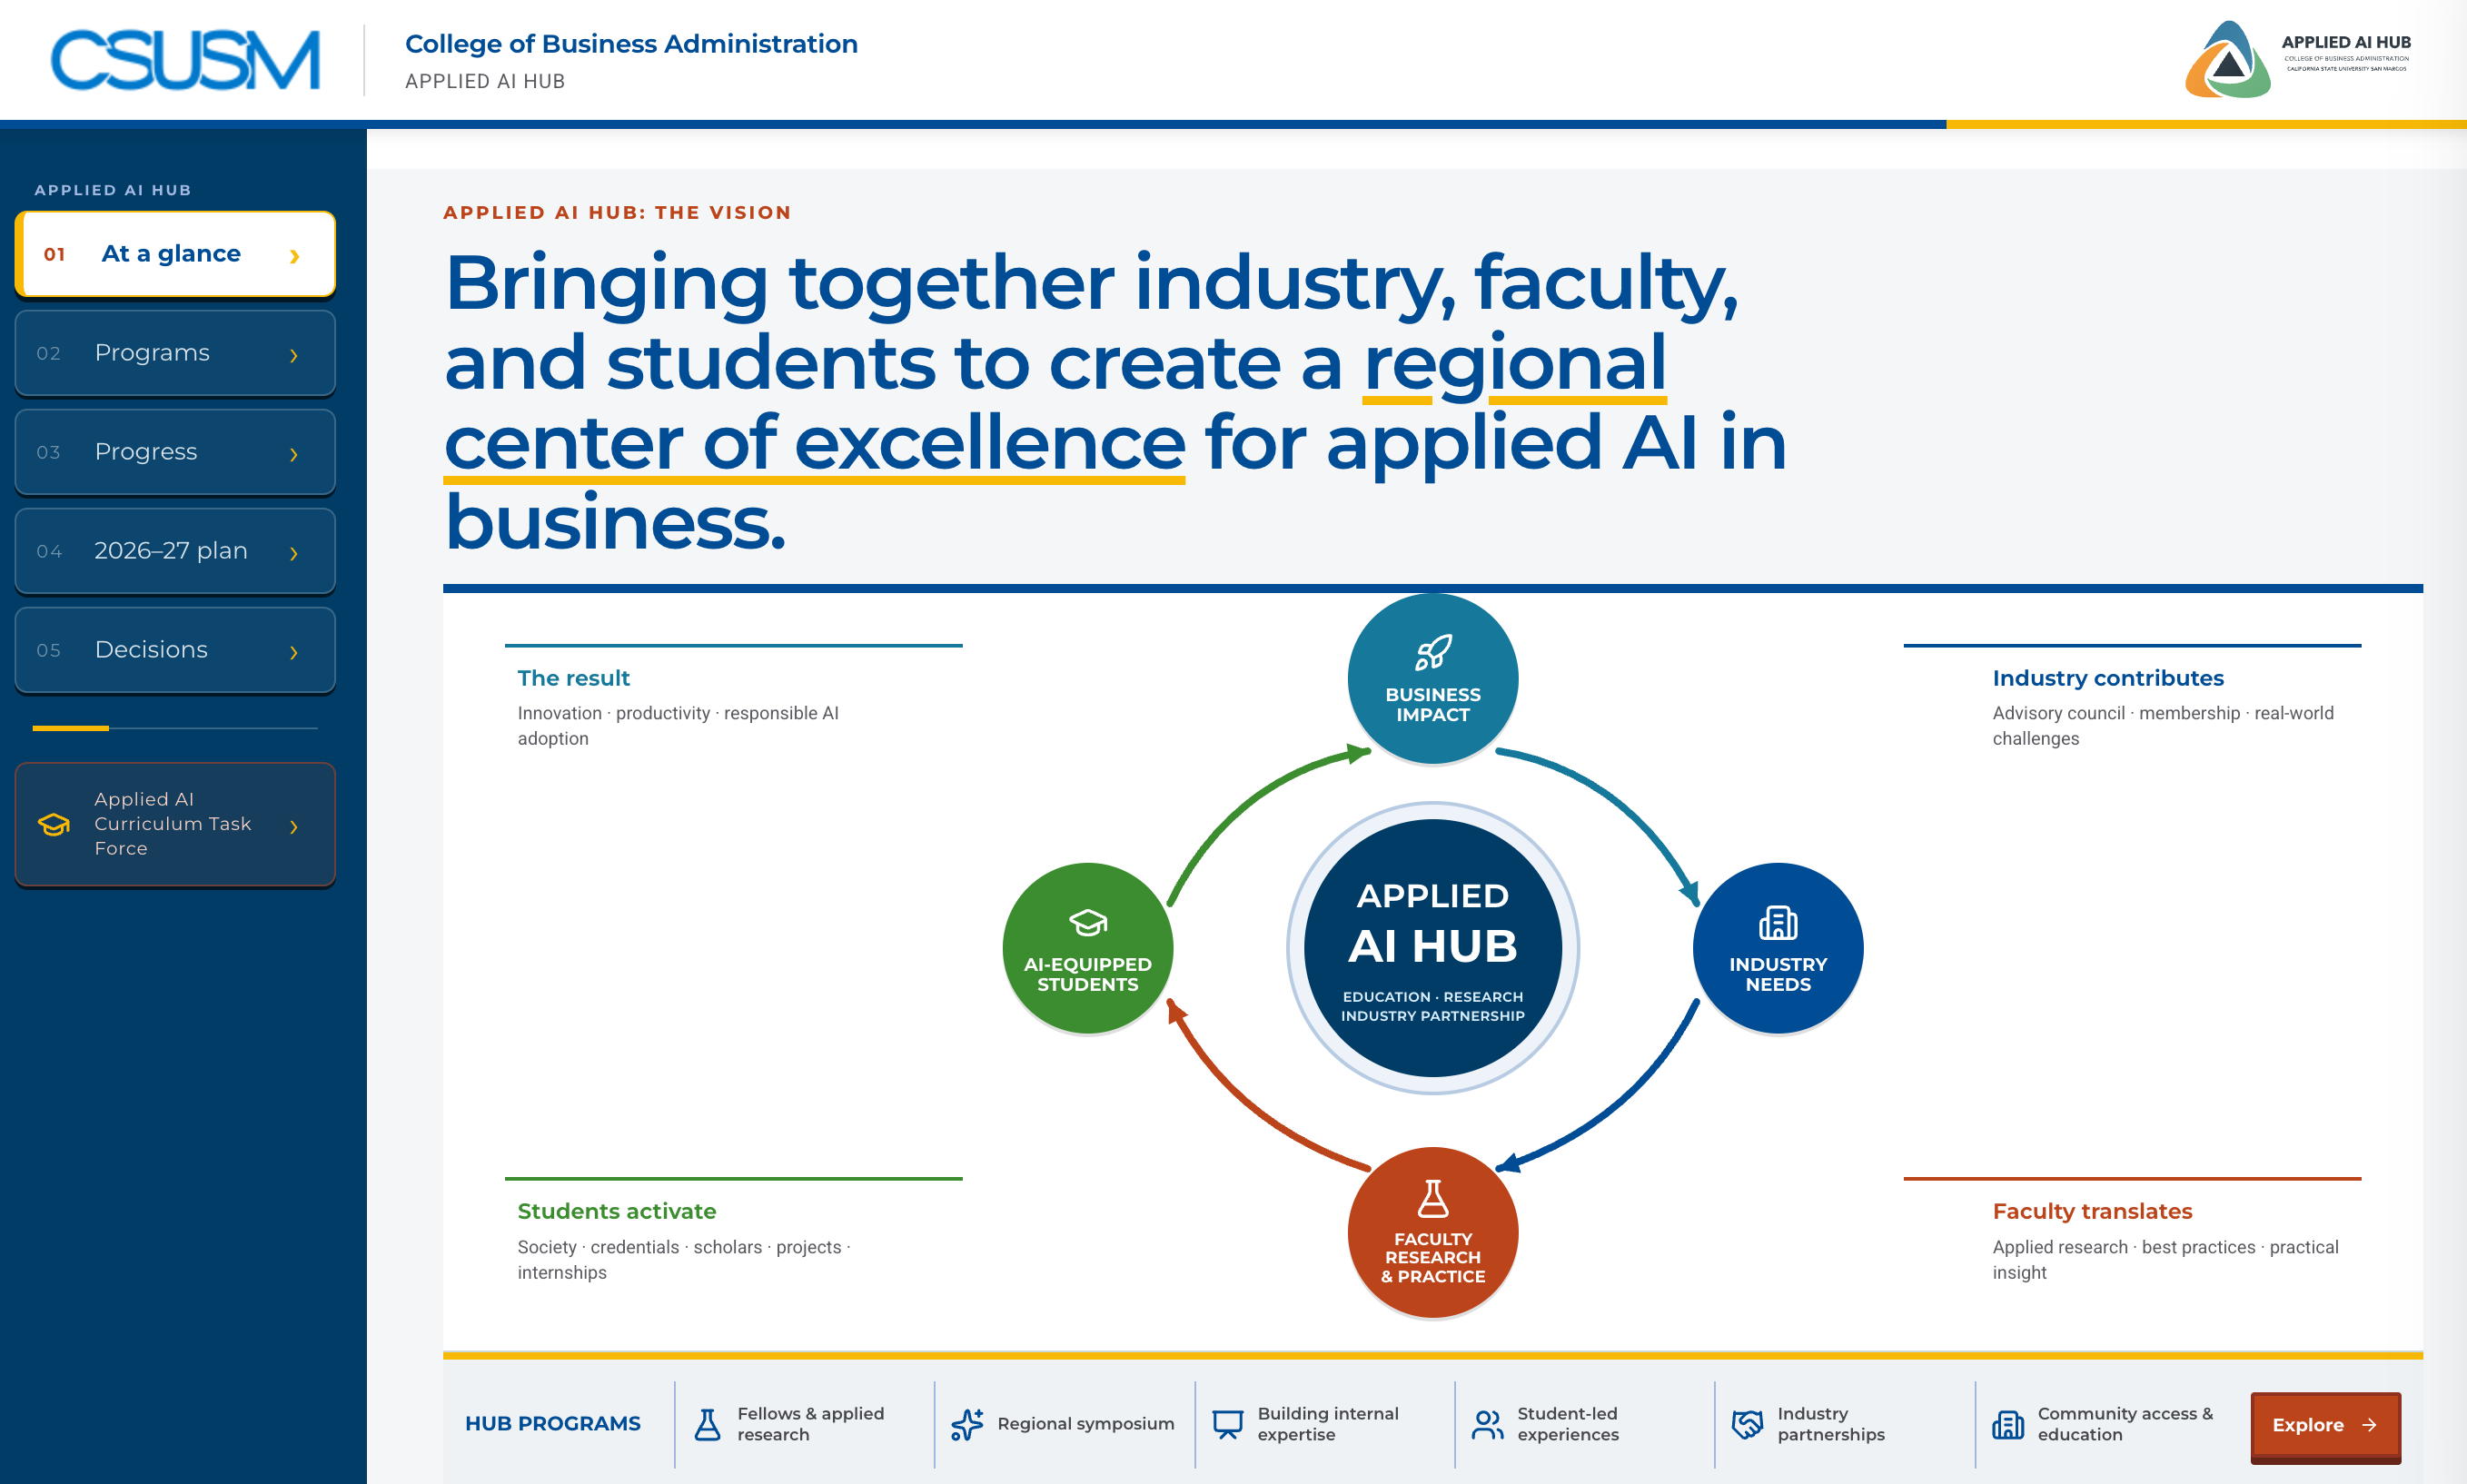
Next, I showed a dashboard I created when I was preparing to meet with the dean’s office about the Applied AI Hub. Our task force had been doing quite a bit of work, and I needed a way to organize it visually so we could have a productive discussion. That dashboard has since become something the task force can use too.
Then I moved into the presentation software.
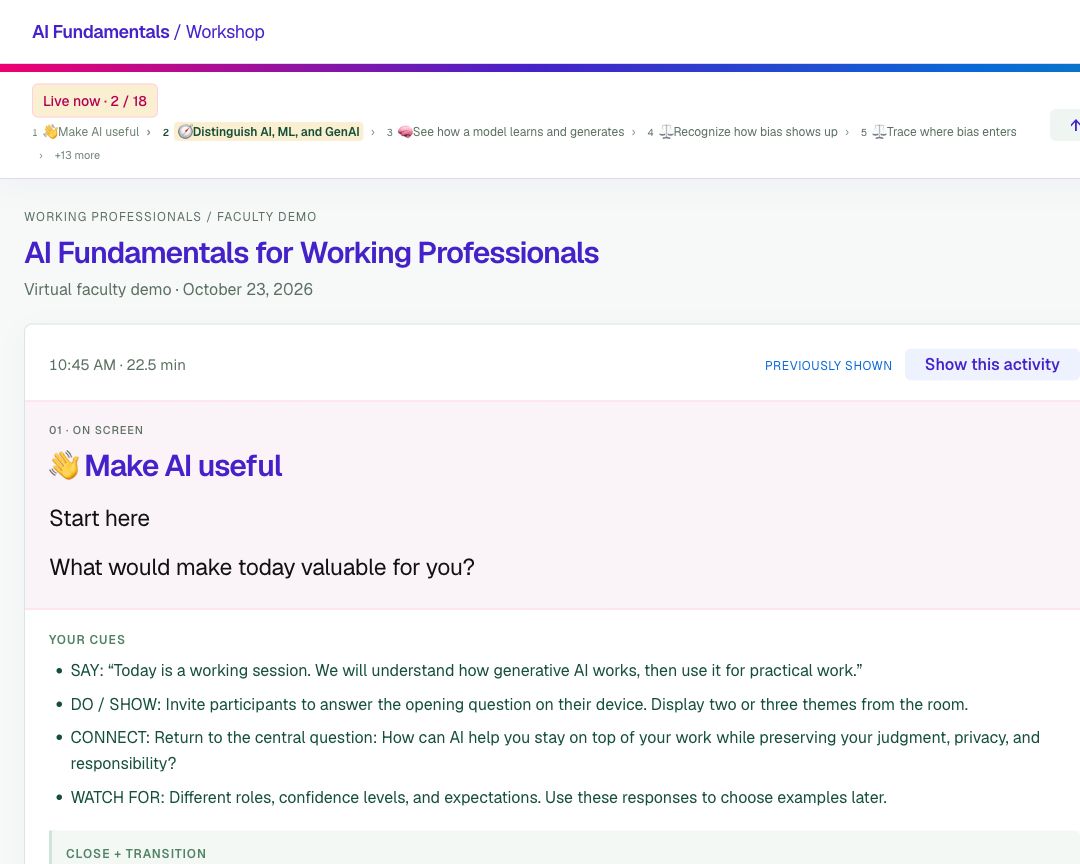
If you’ve ever presented with PowerPoint while also using something like Mentimeter to engage the audience, you know there can be a lot to manage. You’re moving between applications, watching the time, checking responses, and trying to stay with the conversation. I thought, there’s got to be a better way.
So I built something around how I wanted it to work.
There are three views. My speaker view shows the slide, my cues, a transition to the next activity, and how much time I have left. The projector view shows what the room needs to see. The participant view lets people respond from their own devices. The software is focused on engagement. The audience participates on their device, the projector view organizes the entries for audience viewing, and the speaker view shows engagement stats and details.
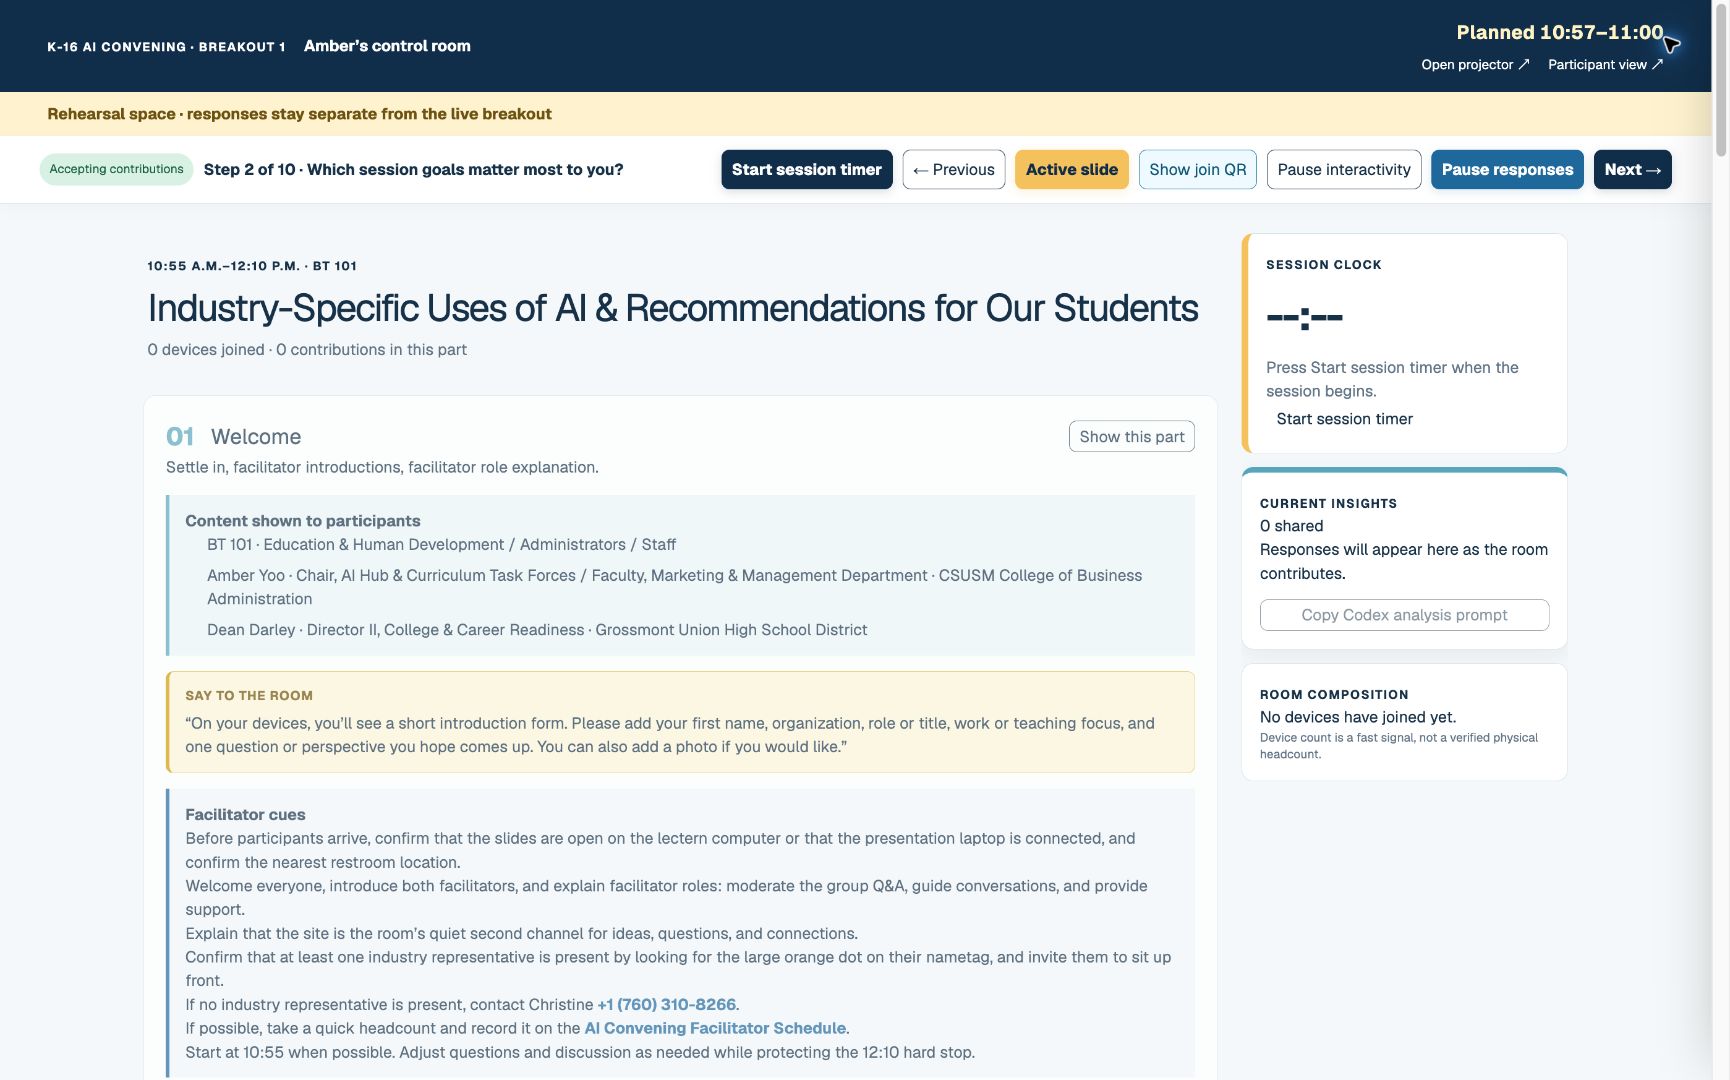
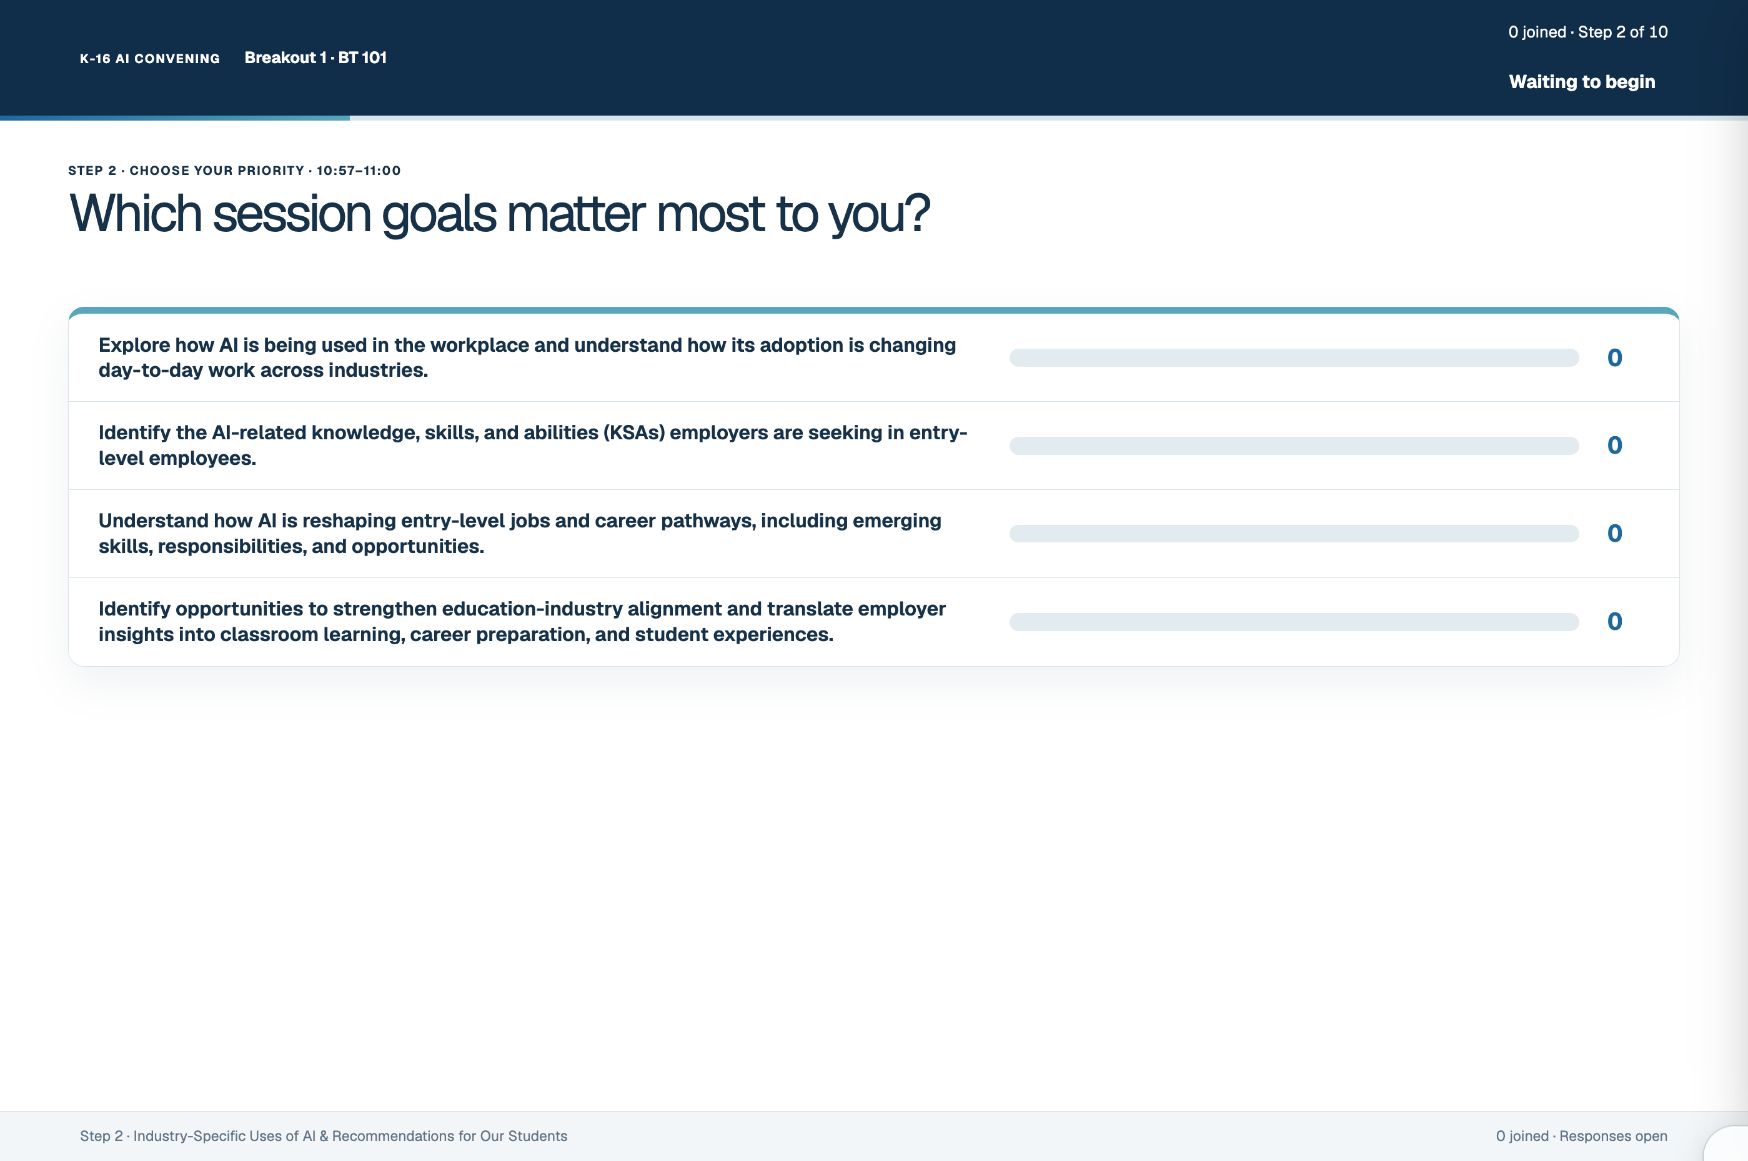
A second example came from the K-16 Regional AI Convening, where I wanted people from industry, education, administration, and workforce organizations to see who else was in the room and what they wanted to discuss. I also showed how I can collect audience responses into a prepared prompt, copy it into ChatGPT, and use the synthesis to respond to recurring themes during the session. I love “owning” my own site because I can run quantitative and qualitative analysis on the site’s collected engagement data afterwards. And of course, I permanently delete all stored participant data after the session is over.
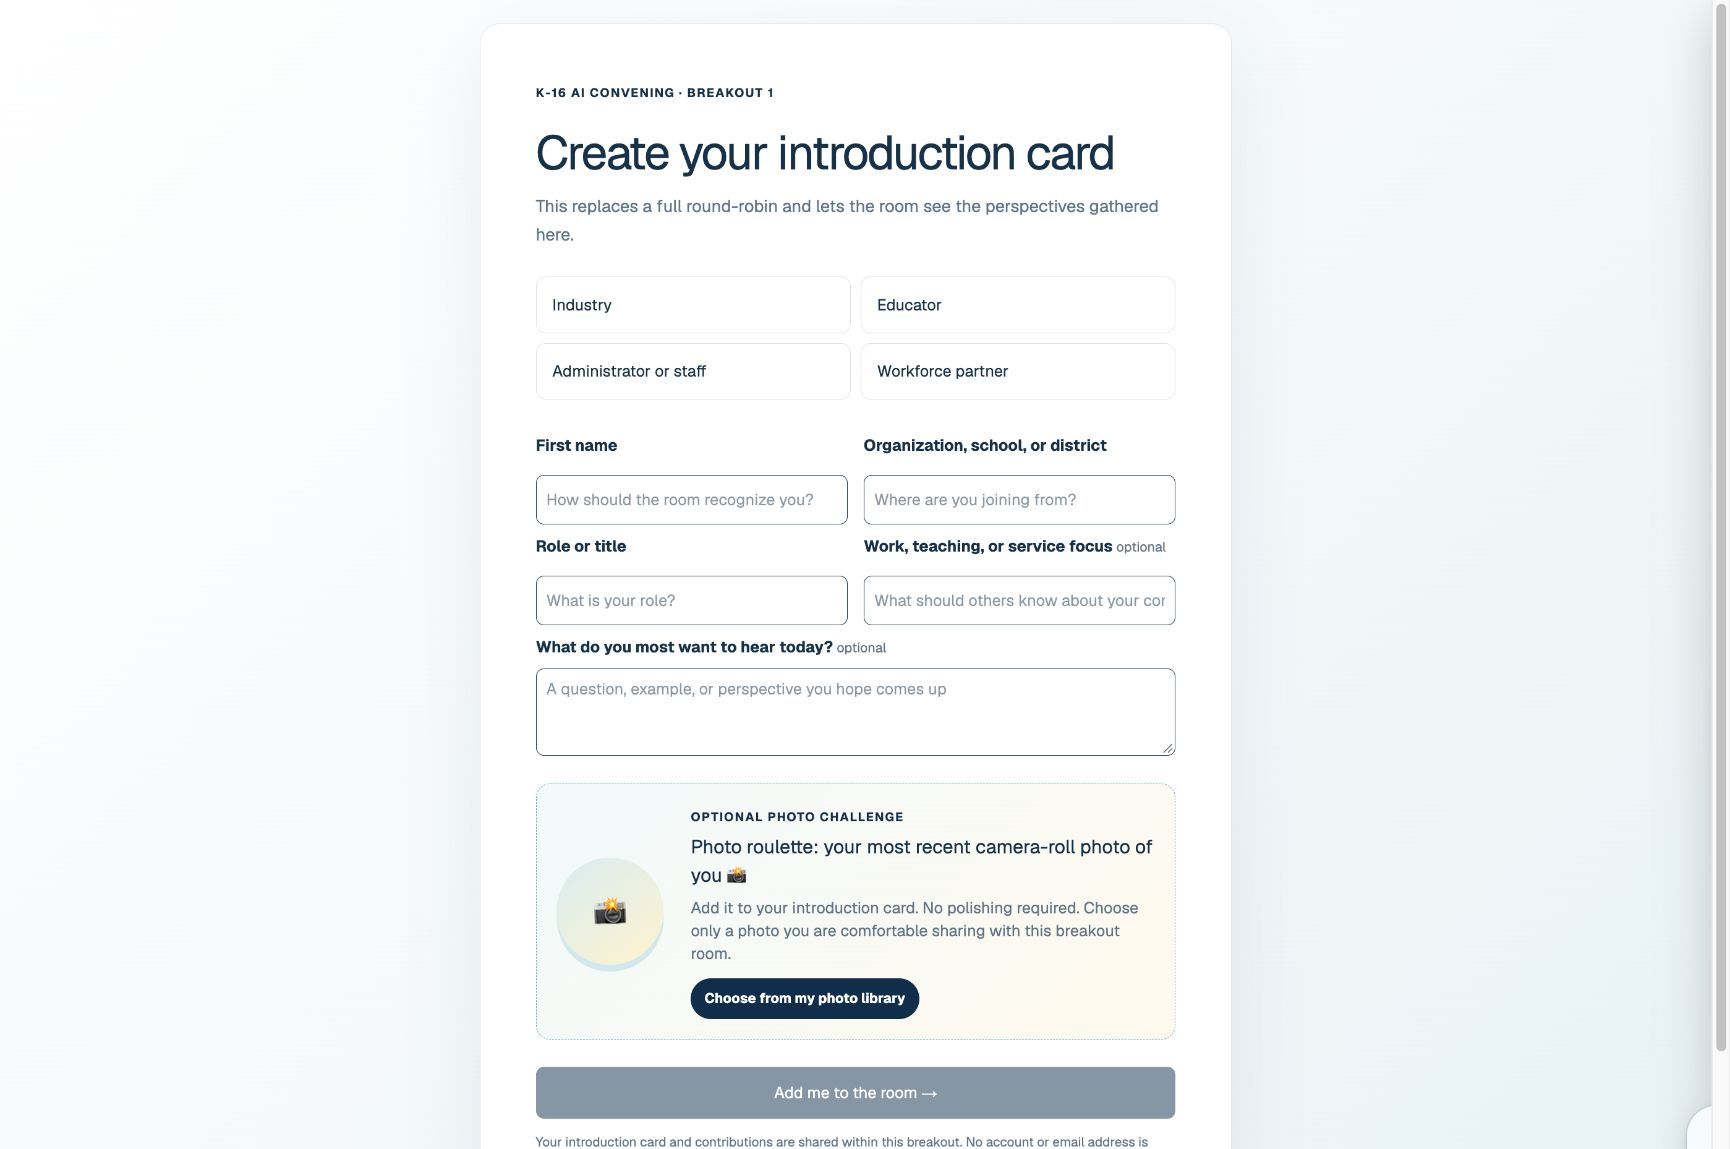
The thinking behind those experiences came from my head. I knew what I wanted participants to be able to do. Agentic AI helped me build it.
That was what I hoped to share: we have so many reasons to communicate with different stakeholders in business, and now we can rethink what that looks like. It can be visual. It can be interactive. It can be built around the conversation we want to have. And those are possibilities we can bring into our teaching and help our students learn to create too.